


Bad Math
Happy October. This is the twenty-second issue of Rabbit Rabbit Rabbit — it’s just like all those other email newsletters, except it still doesn’t know how to convert from Celsius.

There’s still a whole ‘nother month before the election, I already mailed in my ballot, and I’m trying my best to ignore the news until Election Day — so I can live in ignorant bliss until the reckoning. Unfortunately, half the TV commercials during the baseball postseason are political.
The numbers don’t lie (but people do)

How will things turn out? Don’t look to the polls for the answers.
Like most things involving charts, graphs, and multimillion-dollar levels of data crunching, it all seems credible enough. But also like most things in data science, the devil is in the details.
The premise itself isn’t that hard to wrap your head around: Ask a representative sample of the electorate how they’re gonna vote and extrapolate from there.
After all, if generative AI is fancy math that can turn statistical probabilities into fantastical images, realistic videos, convincing conversations, and bad poetry, how hard can it be to create plausible projections from polling data?
Turns out, maybe impossible. In an article for The American Prospect, Rick Perlstein breaks down how “presidential polls are almost always wrong, consistently, in deeply patterned ways.”
It isn’t just that there are so many things that can affect the accuracy of a poll:
Many pollsters’ decisions about methodology are by necessity subjective, even arbitrary. Campbell lists a quick half-dozen: how they list a candidate’s job title; the order in which the choices are stated; the gender of the interviewer; whether it’s done by phone, internet, or in person; even the day of the week.
It’s also that there is always at least one more thing you never accounted for:
In 1966, when Reagan ran for governor of California, he outperformed the polls, apparently because many who voted for him were ashamed to tell a stranger they chose an actor who was labeled an extremist. How should pollsters have weighted the “shy Reagan effect” in 1980? Should they have conjured up a revised weighting in 1984, perhaps one that ran the other way, given Republicans succeeding in those years making voters feel shy about their liberalism?
Not to mention, the humans interpreting all those flawed numbers are themselves fickle and flawed:
The pollsters can likewise be arbitrary once the numbers come in. Lost in a Gallup notes a fascinating experiment carried out by Nate Cohn for The New York Times. He had four pollsters interpret the same raw data from a 2016 poll of Florida. Their choices in how to weight ranged from Clinton winning by four percentage points to Trump winning by one.
I recommend reading the whole article, as it’s a nice reminder of how we tend to grasp at numbers for certainty and clarity, but once you add humans and their egos to the equation, it all just becomes fortune-telling.
And, as we all know from the disclaimer of any investment ad, past performance does not guarantee future results. So, though we pine for cold, hard numbers to tell us our future, they’re more likely to just reflect our present hopes, fears, and self delusions.
Two end-of-season stats
Baseball’s regular season ended yesterday (one day later than planned), and the postseason officially began today. Two teams that didn’t make it to October baseball this year? The Sox.
81–81: The Red Sox were mediocre
The Red Sox’s win-loss record for the 2024 season was a perfect 81–81. It’s not a losing record, but it’s not a winning one, either. In all, the Red Sox ended 25 games with an even win-loss record:
This year, the Sox ended games at 1–1, 2–2, 7–7, 9–9, 10–10, 19–19, 22–22, 24–24, 26–26, 27–27, 28–28, 29–29, 30–30, 31–31, 32–32, 33–33, 34–34, 35–35, 70–70, 74–74, 75–75, 76–76, 78–78, 80–80, and 81–81.
That wasn’t the most times of any team this season, tho — that honor goes to the Tampa Bay Rays, who reached .500 at the end of 33 games. (But they ended the season with an asymmetrical 80–82 total, courtesy of the Red Sox.)
The San Diego Padres achieved the .500 mark at the end of 26 games, one more game than the Red Sox. But the Padres ultimately finished with a 93–69 record — still not good enough to win the NL West, but definitely good enough to keep playing baseball into October.
So what does it mean for the Red Sox to be a perfectly .500 team? It means another long winter.
41–121: The White Sox stunk
Meanwhile, the White Sox reached historic levels of suckiness, ending their season with a 41–121 record, the worst win-loss record since the 1899 Cleveland Spiders.
Here’s what that futility looks like visualized. This chart compares every team’s wins for the 2024 season:
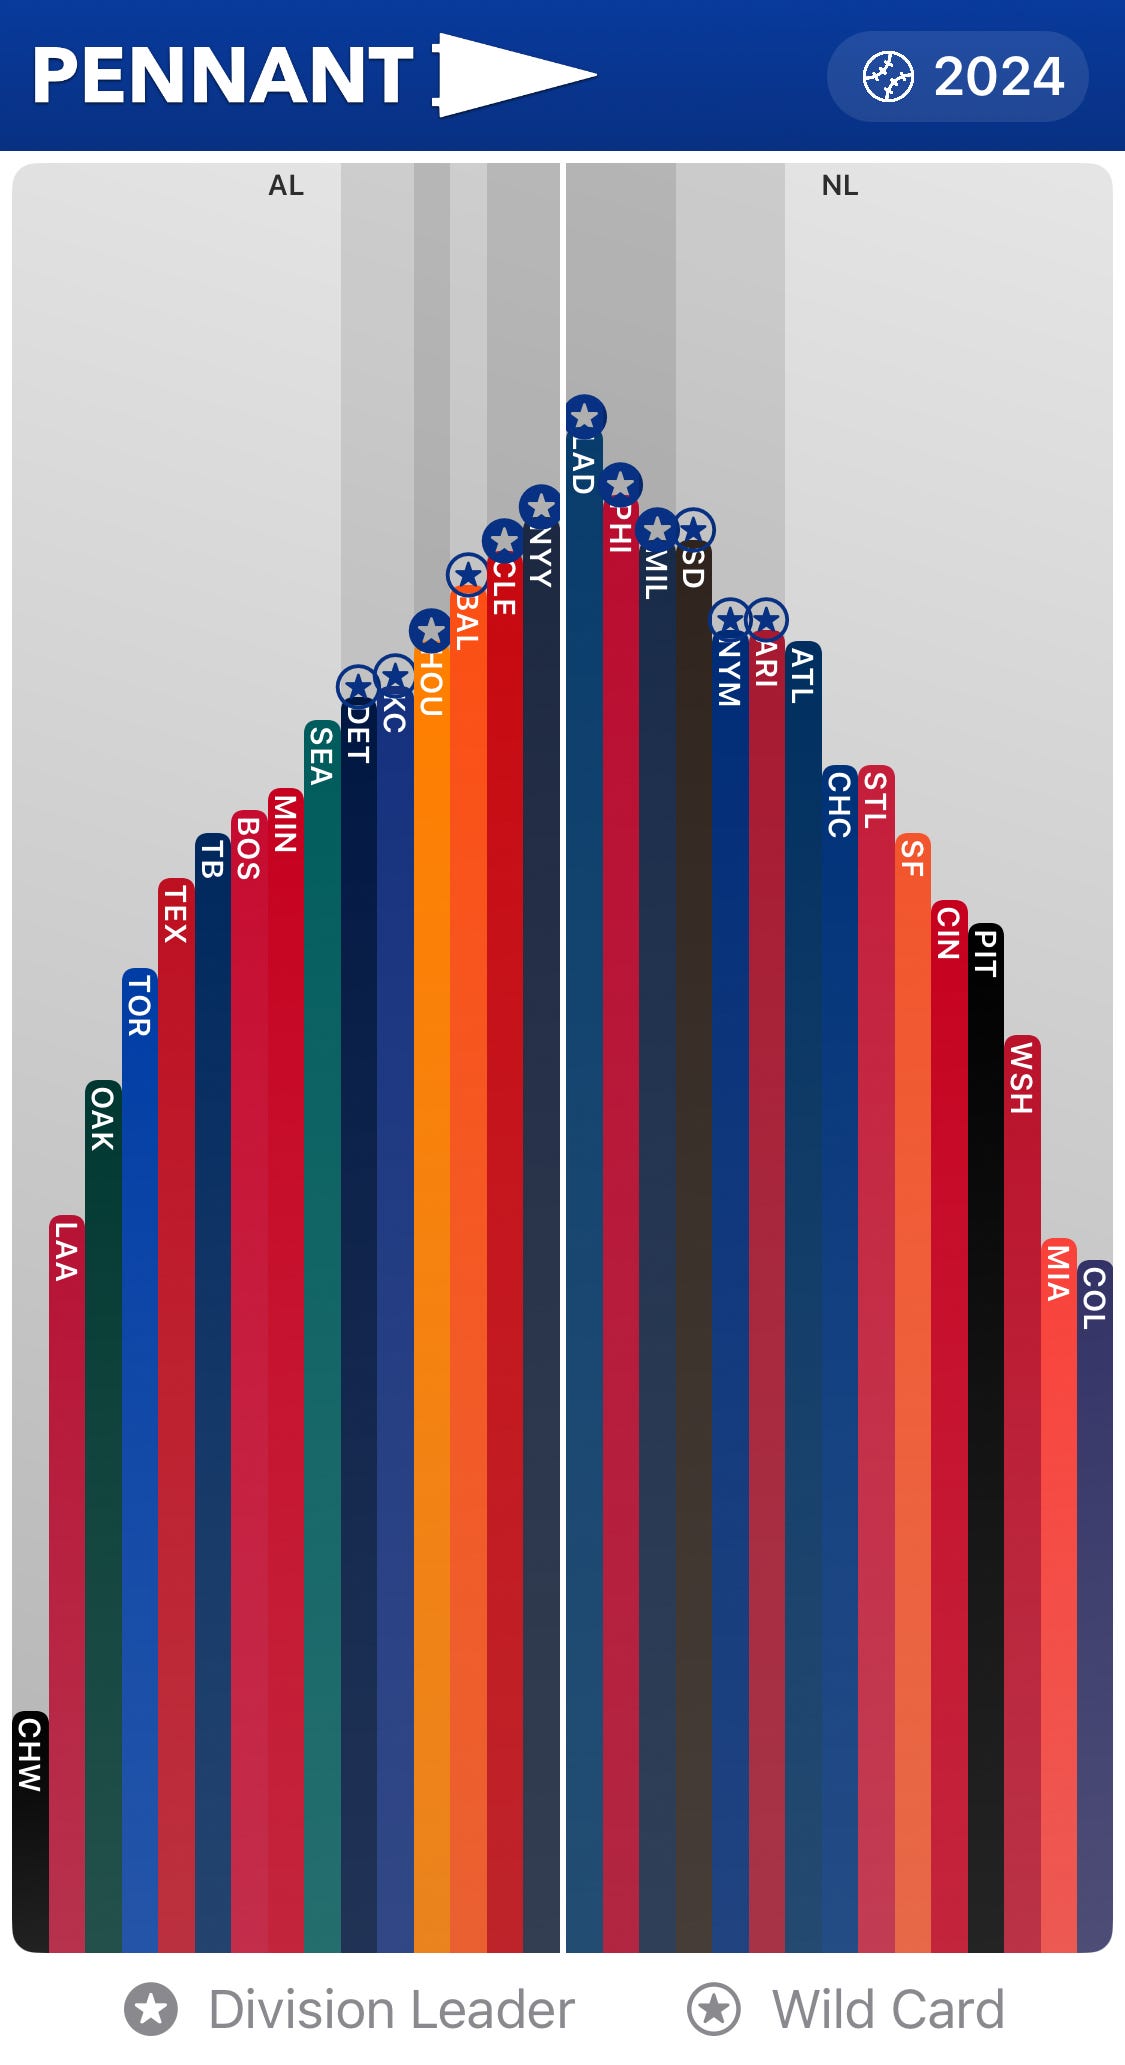
Did you spot the Chicago White Sox (CWS)?
The White Sox grabbed that 41st win in the final game of their season, Game 162, on September 29.
By comparison, the second-worst team, the Colorado Rockies, banked their 41st win with their 111th game, on August 2.
The winningest team of the 2024 season, the Los Angeles Dodgers, reached the 41-win mark with their 66th game, on June 8.
And the Philadelphia Phillies were the fastest team to reach 41 wins — they did it with their 59th game, on June 1.
Imagine if the Phillies had never won another baseball game after June 1. That’s basically the 2024 Chicago White Sox.
Other rabbit holes
WSJ: ”Under scrutiny, Wall Street says it’ll limit hours”. No more than 80 hours a week! We promise! 🙃
The Atlantic: “Legalizing Sports Gambling Was a Huge Mistake”. You don’t effin’ say. 🙄
How to Monetize a Blog. Easy-peasy! 🤑
And that’s it for this month’s edition. Have a good one.
jf